
Tanya Rogers FSU Coastal & Marine Lab
 “Spat tiles” are a tool our lab commonly uses to measure the growth and survivorship of juvenile oysters under different conditions, and we’ve used them with varying degrees of success in many of the experiments chronicled in this blog. What these are essentially (in their final form, after a good degree of troubleshooting), are little oysters glued to a tile, which is glued to a brick, which is glued to a mesh backing, which is zip tied vertically to a post. Rob and I have put together a couple interesting slideshows chronicling the growth of these spat over time from two of those experiments. Ever wonder how fast oysters grow? Observe…
This is a time series from our first spat tile experiment, which you can read about in this post. As you may recall, this experiment was largely a failure because the adhesive we used to adhere the spat was inadequate. However, we decided to keep the fully caged tiles out on the reefs to see how they fared over time in different locations. I photographed the tiles every 6 weeks or so, so that we now have a series showing their growth over time. The slideshow shows one of the tiles from Jacksonville. It starts in October of 2010. You’ll notice that not much growth occurs though the late fall and winter, but the spat start to grow noticeably from April-June 2011. From June-September the spat grow explosively and many new spat settle on the tile from the water column and grow equally rapidly. Just as plants (and algae) have a summer growing season, so too do the oysters that feed on them, when conditions are warm and there is abundant phytoplankton in the water to eat.
Next is a series of images from our caging experiment last summer, which you can read about here. Our large cages contained either:
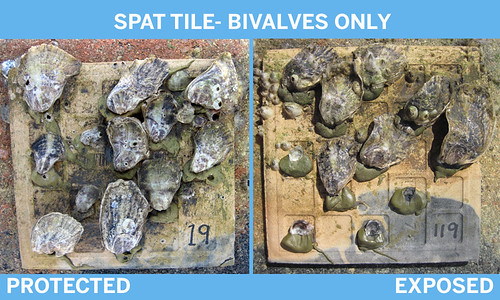
no predators (bivalves only),
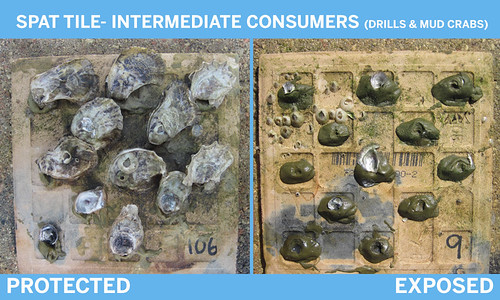
spat-consuming mud crabs and oyster drills (consumers),
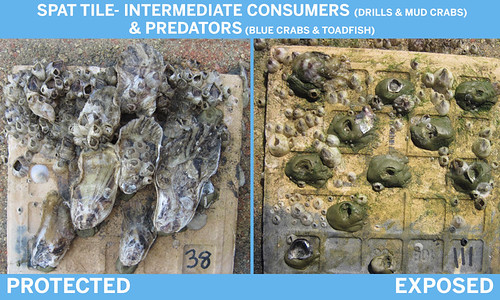
or mud crabs and oyster drills plus blue crabs and toadfish (predators).
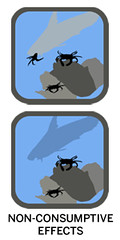
The spat tiles within the larger cages were placed either exposed to potential predators or protected from them in a smaller subcage. Here are typical examples of what tiles looked like at the end of the experiment (about 2 months after starting). You can see how all the spat on the unprotected tiles were wiped out in the consumer treatments, but a good number survived in the treatments with no predators, as we would predict. In the predator treatments, most of the spat on unprotected tiles were removed, but not as fully or quickly as in the consumer treatments, which we would predict if the predators are inhibiting consumption of spat by the mud crabs and drills through consumptive or non-consumptive effects. You’ll see one tiny spat holding on in the predator tile shown. On the protected tiles, most of the spat survived in all treatments, as expected. We plan to further analyze the photographs from the protected tiles though, to see whether spat growth rates differed between them. We may find that protected spat in the consumer treatments grew slower than in the other treatments because of non-consumptive predator effects.
Currently, we’ve recovered most of our arsenal of spat tiles from the field, and I say we have probably amassed enough bricks to pave an entire driveway! Good thing we can reuse them!

The Biogeographic Oyster Study is funded by the National Science Foundation.
2 comments
Tanya, these photographs really demonstrate the contrast so vividly of the protected and exposed sites. Thanks for helping us understand the results of the work you are all doing!
[…] various frozen components of great cage experiment of last summer, including the several hundred spat tiles placed inside the different cages at all sites along the coast. It was while delicately measuring […]
Comments are closed.